Typically, when you create a Power BI report, you provide the end user a view to the present and past time. For decision makers this rarely is enough, since decisions should be also based on predictions of the future. In this blog post I’ll introduce a demo case where an interactive report is created to enable user to simulate future sales and see how that reflects to capacity forecasts of factory product lines.
Business case
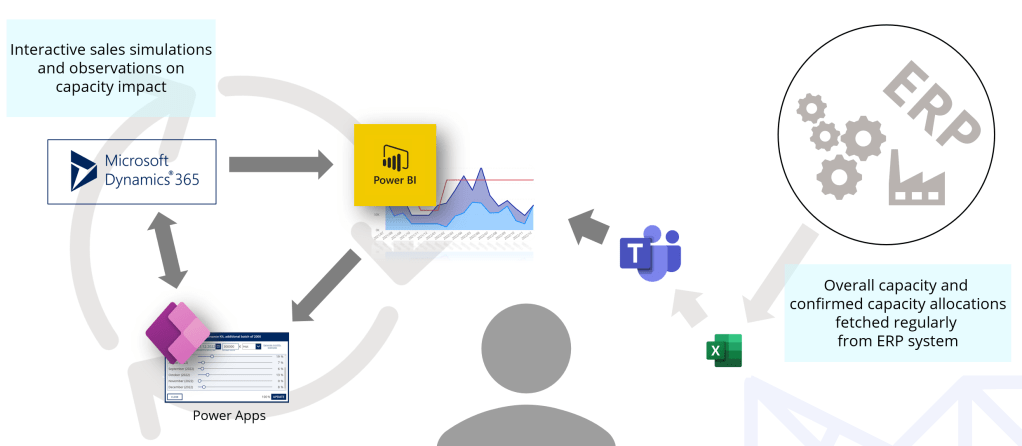
The whole idea of the report is to enable the end user to modify sales oppoertunities so, that the user can immediately see the impact of the opportunity on the future capacity allocations. In the demo scenario an opportunity capacity requirement is spread accross multiple months starting from the estimated opportunity close date and ending at the final delivery date. This distribution of the delivery over months is something that the sales person can discuss with the potential customer, and the sales person can use this report to have an understanding on what would be the best proposal to give the customer from the future capacity perspective.
The report works like in the video below.

In the video the sales person first selects the opportunity he wants to examine. He then fills in final delivery date which is a custom field that is added into opportunity table. Once he’s done he populates monthly distribution of the delivery batches.
At first the delivery is spread evenly across months. However, the report user can tweak each month’s delivery allocation by adjusting the appropriate percentage slider.
Whenever the user clicks on the Update button monthly percentages are updated directly into Dataverse table and the report view is refreshed. This way user can see his adjustments immediately reflected in the report visuals never leaving the report view!
Main implementation points
Adding Power Apps visual and creating the app
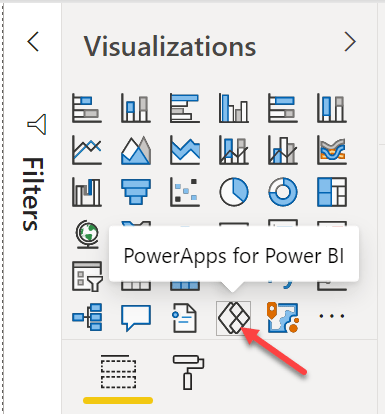
Open up Power BI Desktop and start editing an existing report you want to embed Power Apps app into. Start embedding by adding PowerApps for Power BI visual on the report page.
Now, as with any other visual in Power BI, you can provide data to the visual. In my demo scenario I only pass on Opportunity Id to the app. Once you have configure PowerApps Data, the visual gives you an option to create a new Power Apps app. Proceed by clicking the Create new button.
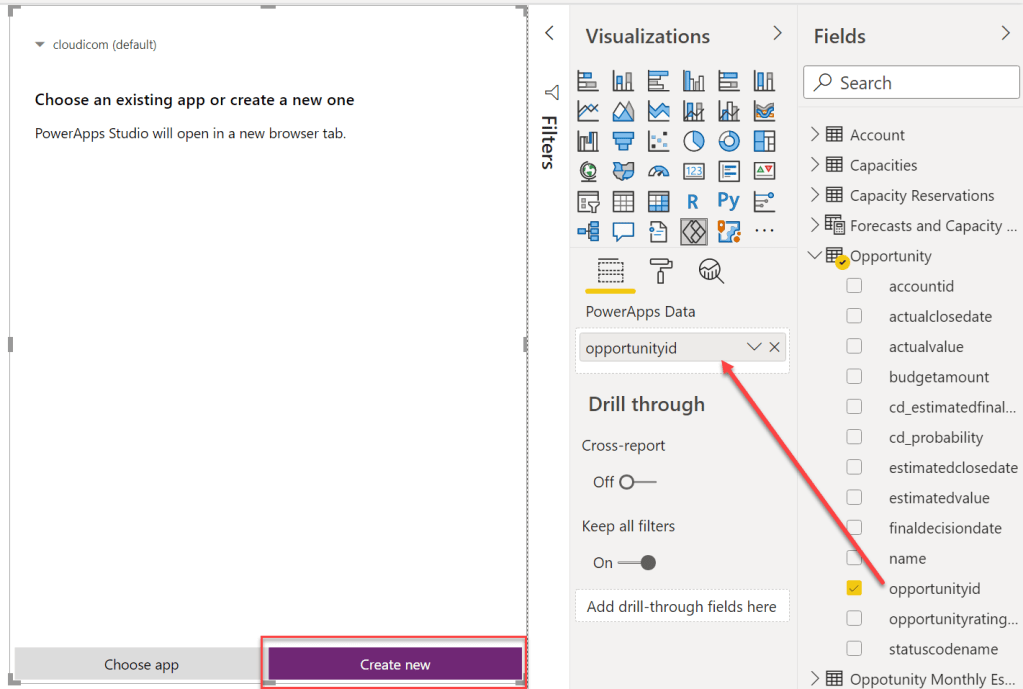
Power Apps Studio is opened and you can start crafting your app!
Consuming report data in the app
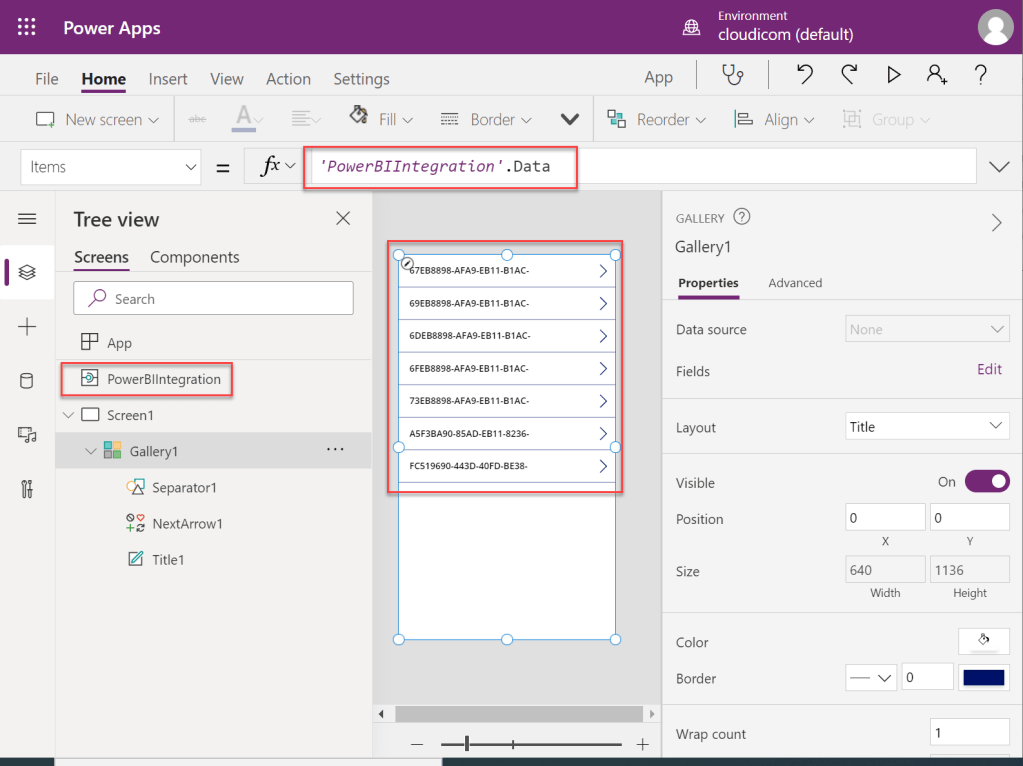
Right after you’ve created the app in the previous step, you are presented with a view as below. What you have:
- PowerBIIntegration integration component visible in the Tree view
- One screen populated with a Vertical Gallery control
- Gallery’s data source configured as ‘PowerBIIntegration’.Data
You can now start editing the app as you please, depending on your use case. At least you need to add some data sources to your app if you’re planning to make some data updates via the app.
Refreshing report view after updated data is saved
Once you have modified the app and created some sort of functionality to update data back to the datasource, it’s time to refresh the report view. It is really easy to tell Power BI report page to update the visuals: you can call Refresh() method provided by the PowerBIIntegration. Below is the saving logic of my demo app’s Update button. Refresh is called at the very end (line 24).
Set(IsUpdating, true);
Patch(
    Opportunities,
    First(galHiddenOpps.AllItems).opportunity,
    {
        'Est. Close Date': dateEstCloseDate_1.SelectedDate,
        'Estimated Final Delivery Date': dateEstFinalDeliveryDate_1.SelectedDate,
        'Est. Revenue': Value(inputEstRevenue_1.Text),
        Rating: If(IsBlank(selectHotness_1.Selected), First(galHiddenOpps.AllItems).opportunity.Rating, selectHotness_1.Selected.Value)
    }
);
ForAll(
    RenameColumns(galAdjustMonthlies.AllItems, "cd_opportunityforecastmonthlyestimatesid", "recordid") ,
    Patch(
        'Opportunity Forecast Monthly Estimates',
        {
            'Opportunity Forecast Monthly Estimates': recordid
        },
        {
            'Percentage of Total': Value(lblPercentageValue_1.Text)
        }
    )
);
PowerBIIntegration.Refresh();
Set(IsUpdating, false)
Using DirectQuery
Calling the Refresh() of the PowerBIIntegration has the same effect as clicking on the Refresh visuals icon on the Power BI report. It refreshes the visuals but does not refresh the underlying dataset.

Therefore, if you want user’s data changes in the app reflected immediately on the visuals, you must use DirectQuery! Please note, that only a subset of possible Power BI data sources support DirectQuery. Thankfully Dataverse is one of them!
If your data source supports DirectQuery, you can use the Data Connectivity mode when making connection to the data source in the Power Query Editor.
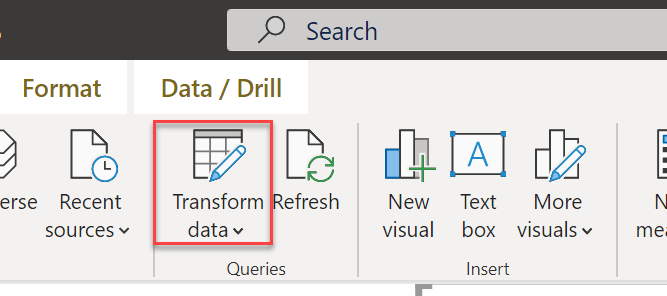
Click on the Transform data ribbon action.
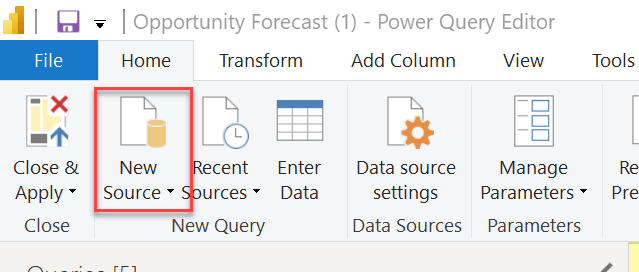
In the Power Query Editor, select New Source ribbon action.
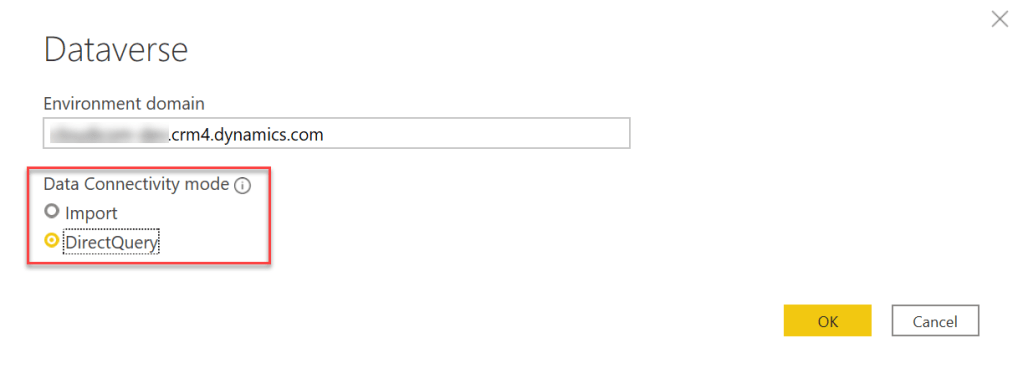
If you select data source that supports DirectQuery, you are presented with an option to use that instead of Import mode:
Change Data Connectivity mode to DirectQuery and click OK.
Now you’re good to go! That query will now fetch all the data in real-time from the backend system once the user (or you embedded Power Apps app!) interacts with the report!
Things to remember
Some final notes to keep in mind with this sort of setup.
Don’t forget to share the app! You must share the embedded Power Apps app – it doesn’t get shared automatically along sharing the report.
If you are using an app someone else has built, you must really trust the author of the app. You are providing your report data to the app, so it is crusial that you know what the app does with it!
Choosing DirectQuery over Import mode is not a choice to be done lightly, as outlined, for example here:
